What a good screenshot looks like
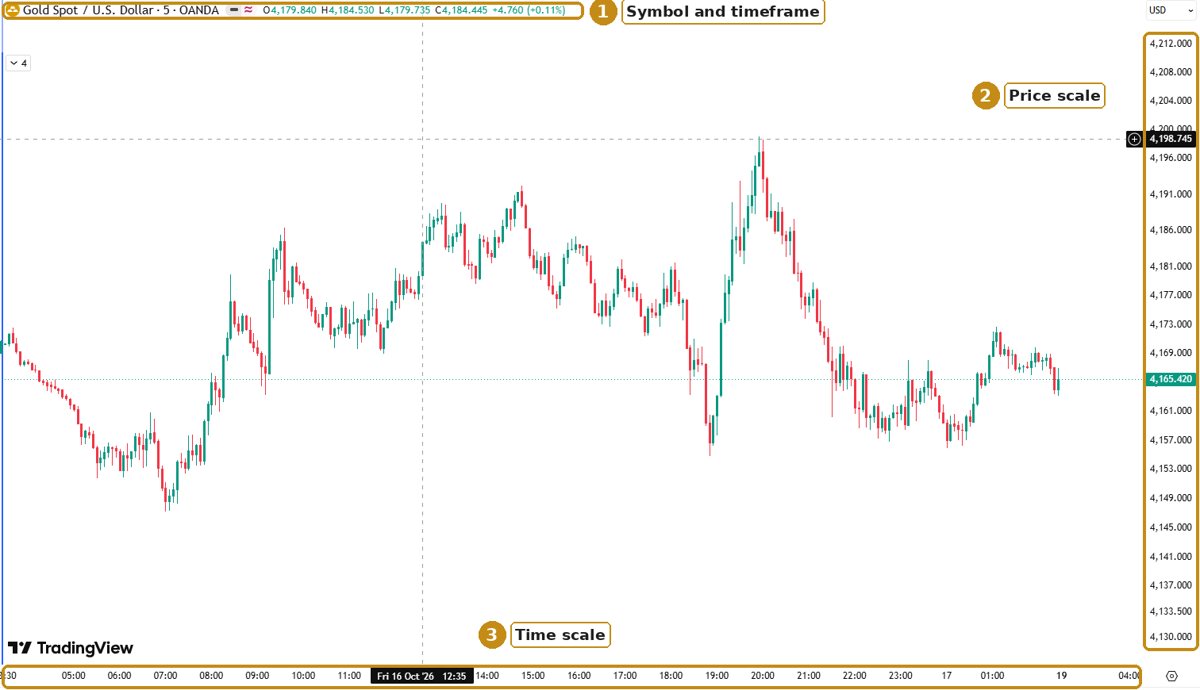
Upload something like the chart below: one chart, filling most of the picture, with the three things marked on it in view.
One chart analyzer for forex, gold, stocks and crypto
The analyzer reads a picture, so it works with any market and any charting platform you can take a screenshot of:
- Forex charts: EURUSD, GBPUSD, USDJPY and other pairs, on any timeframe from 1 minute to monthly.
- Gold and indices: XAUUSD, US30, NAS100, and Indian index charts such as the Nifty and Bank Nifty.
- Stock charts: Indian and US shares, from TradingView or your broker's app.
- Crypto charts: Bitcoin, Ethereum and other coins, from TradingView or an exchange's chart.
- TradingView and MetaTrader 5 (MT5): screenshots from TradingView, MT5, MT4 and cTrader all work. Candlestick charts give the fullest answer, because the AI can also describe the candles.
It's an online tool: there's nothing to install and no account to make, and it works in a phone or desktop browser.
What it does, and what it won't do
It reads one screenshot and describes it in plain words, in English or Hindi: whether the swings point up, down or sideways, where the price has bounced or turned back, which patterns traders would recognise, what the last few candles look like, and what any indicators on the chart show. Each answer links to the PipLedger guides for the ideas it mentions, so you can look up what a term means and how traders use it.
It won't tell you to buy or sell, suggest an entry, a stop loss or a target, or say where the price will go next. The AI is instructed not to, and before you see the answer the site also removes sentences with common trade-call or forecast wording. An AI can still word something badly, so read every answer as a description, never as a reason to trade. PipLedger is not a SEBI-registered investment adviser or research analyst, and this is not investment advice.
How to get a clear reading
- Crop the screenshot to the chart, but keep the price scale and the time scale in view so the AI can read prices.
- Leave the symbol and the timeframe showing (TradingView and MT5 usually show them at the top left of the chart).
- Use one chart per image. A chart zoomed out to thousands of candles is harder to read than one showing the last few days or weeks.
- Indicators help only if their lines or values can be seen. Light and dark themes are both fine.
- Don't include your name, balance, account number or open positions.
What happens to your image
Your browser first makes a smaller copy of the screenshot (at most 1,600 pixels on the longest side) and sends that copy to our server on Cloudflare, which passes it to Google's Gemini API to write the description and sends the answer back to you. PipLedger doesn't save the image or the answer. Under Google's terms for the Gemini API's free tier, which this tool uses, Google can use what's sent to it to improve its products, and human reviewers may read it, so upload only chart screenshots without personal details. Your IP address is held in the server's memory to limit how often one connection can use the tool; it's dropped after about ten minutes and isn't written to any log or database.
You need to be 18 or older to use it. It isn't available in the UK, the European Economic Area or Switzerland for now, because Google allows only its paid service to be offered there.
Why the AI can get it wrong
An AI model reading a picture can misread a number on the price scale, miss a small candle, or see a pattern that isn't really there. Treat the answer as a second pair of eyes, not a measurement: check every level on your own chart, and read the line at the end about what it wasn't sure of. It knows only what's in the image, not the news, the economic calendar or your account.
Learn the ideas behind the answers
The terms in the answers are explained, with examples, in these guides (the strategy guides also come with a free TradingView script): support and resistance, market structure (BOS and CHoCH), candlestick patterns, head and shoulders, price action, order blocks and fair value gaps. Every strategy on the site is compared on one page in trading strategies, and the lot size calculator works out a position size from your own stop.